ProofDecline-risk scoring modelFlyRank internship
Three cases from one build.
All three come from the same decline-risk scoring model, built on two slices: a bundled 30,000-row CSV and a March–April warehouse extract. Every number below is reproducible from the linked code.
that carried the result
The model was scoring rows whose answer was fixed by arithmetic.
Of the 30,000 rows in the bundled CSV, 3,388 (11.3%) had zero impressions in the prior 30 days, and every one of them was labelled not-declining — impressions cannot fall below zero. The model was scoring a population that contained thousands of rows whose answer was fixed before any feature was read.
Scoring only the 26,612 pages where decline was arithmetically possible, the random forest's ROC AUC fell from 0.750 to 0.565 and Precision@50 from 0.740 to 0.600, against a base rate of 0.611.
The model was doing a job I could have done with a filter. The hard question — which of the pages that could have gone either way actually declined — is the one it could not answer.
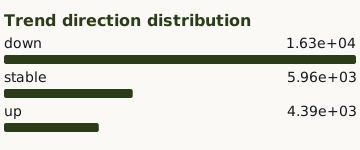

outputs/charts/trend_distribution.svg, recoloured and re-typeset for narrow screens, data unchanged.Two pipelines, two populations
The 0.565 above is not the number on the deployed paper, which reports 0.645. Both come from the same 30,000-row extract under different filter orders and different validation. Both are correct.
| This page | The paper | |
|---|---|---|
| Scored population | 26,612 | 26,604 |
| Filters | zero prior impressions | no recorded position, then zero prior impressions |
| Validation | one runtime, single split | mean of 5 client-grouped folds |
| Feature set | not named | permissive |
| RF ROC AUC | 0.565 | 0.645 |
| RF Precision@50 | 0.600 | 0.844 |
| Base rate | 0.611 | 0.611 |
The counts differ by 8 because the filters overlap: 1,205 rows have no recorded position, 3,388 have zero prior impressions, and 1,197 are in both.
The 0.600 comes from unnamed features on a single runtime. The 0.844 comes from five client-grouped folds on the permissive set. The model did not get better between the two — the single-runtime measurement is the weaker one.
The number that didn't reproduce
I ran the filtered pipeline twice in separate directories and got identical numbers, so the pipeline is deterministic. That means the published 0.680 and the fresh-clone 0.740 cannot both come from this code on this data — the committed report was generated by an earlier state of the repo, or under different library versions. I have not confirmed which. The report was regenerated from a clean clone on 2026-08-09 and the 0.680 is withdrawn.
measured, not assumed
Whole clients held out, and what that actually bought.
On the March–April warehouse slice, I held out whole clients rather than random rows, so no client appears on both sides of the split — a model that memorises one client cannot score itself on that client's other pages.
I did not assume this was working; I measured it. The grouped split scored 0.901 against a random split's 0.908, so the method bought me 0.008 here.
That is a small number, and reporting it small is the point: had the gap been large, it would have meant the random split was leaking badly. Either result is worth knowing, and you only know which one you have if you run both.
The split function is in the repo.
what I didn't build on
Zero-filled is not the same as empty.
In the March warehouse slice, only 413,966 of 9,841,378 daily rows had GA4 available — 4.2%. The rest were not empty; they were zero-filled, which would have dragged any engagement average toward zero without anything looking wrong on the surface.
In that slice I carry ga4_usable as a 0/1 flag alongside the GA4 features, so the model is told which is which. At item grain those features are 59% missing, and they are missing because a client had no GA4 that month, not because a page had no engagement. That distinction decides whether a GA4 feature measures behaviour or just identifies a client.
Porting the check into scripts/ found it inert there. On the bundled CSV all 26,612 prepared rows have GA4 activity, across all 32 clients, so ga4_usable is constant 1 and separates nothing. It is still derived before any zero-fill, and feature_metadata.json records ga4_usable_is_constant so a later run cannot mistake it for working evidence. The refusal holds on the slice that needed it; on this one there was nothing to refuse.
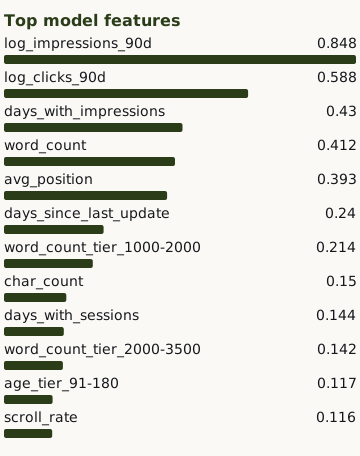
data/window_contract.json now refuses any warehouse source whose feature window is still open when the label window starts; this slice is exempt with the reason recorded, because enforcing it drops logistic regression to 0.524. Source: 
outputs/charts/top_feature_importance.svg, recoloured and re-typeset for narrow screens, data unchanged.what's still wrong
Seven things I know are wrong with this model.
Or with how I reported it — written up, each with a fix beside it or an honest note that no fix is applied, on the failure modes page.